
The transformation of flat aluminium and galvanized steel sheets into complex, three-dimensional engineering components—such as automotive fenders, door inner panels, structural crossmembers, or appliance housings—relies heavily on deep drawing and stretch forming processes. Success in high-speed industrial press shops depends on the interaction between blankholder forces, lubricant performance, tool geometry, and the intrinsic plastic deformation characteristics of the sheet metal. Deep drawing involves pulling a flat sheet blank into a die cavity using a moving punch, inducing complex multiaxial stress fields that test the material’s limits against localized thinning, necking, wrinkling, and tearing.
- Deep Drawing Die Setup Configuration
- [ Punch ]
- |
- v
- +———————————–+
- | Blankholder [Sheet Blank] Blankholder |
- | Force (F_b) ========== Force (F_b) |
- +———–+ +———–+
- | (Die Cavity) |
- | / \ |
- +–+ +—–+
Stress States and Deformational Mechanics in the Draw Zone
During a deep drawing operation, distinct regions of the sheet blank experience fundamentally different stress states:
- The Flange Region: As the blank is drawn inward toward the die cavity, the material in the outer flange experiences radial tensile stress ($\sigma_r$) generated by the punch pulling the sheet, combined with heavy circumferential compressive stress ($\sigma_\theta$) caused by the continuously shrinking perimeter. If the circumferential compressive stress exceeds the local elastic buckling threshold of the sheet, the flange will buckle and form severe wrinkles. To prevent wrinkling, a blankholder applies a controlled clamping force ($F_b$) to hold the flange flat while allowing it to slip inward.
- The Die Radius: As the material moves out of the flange, it bends and unbends over the die shoulder under high normal pressure and friction, experiencing combined bending and tensile stresses.
- The Cup Wall: Once inside the cavity, the material forms the vertical wall of the drawn part, transmitting the tensile load from the punch face back to the flange.
- The Punch Radius and Base: The central zone directly beneath the punch face is subjected to biaxial tension. Minimal material flow occurs here; instead, the sheet stretches over the punch radius. Excessive punch friction or an overly sharp punch radius can cause severe localized thinning, leading to tensile splitting at the base of the cup wall.
- Stress States in Deep Drawing
- Flange Zone Cup Wall / Base Zone
- Radial Tension <– | –> Pure Tensile Load ^
- Circumferential –>|x|<– Compressive |
- (Risk: Buckling & Wrinkling) (Risk: Localized Thinning & Tearing)
Key Formability Parameters: $n$-value and $r$-value
A sheet metal’s response to these complex stress fields is quantified by two fundamental mechanical parameters measured during uniaxial tensile testing:
Strain Hardening Exponent ($n$-value)
The $n$-value measures the material’s capacity to work-harden under plastic strain, governing the true stress-true strain relationship in the plastic regime ($\sigma = K \epsilon^n$). A high $n$-value (typically $> 0.20$ for deep-drawing quality steels and $0.22$ to $0.28$ for annealed aluminium) indicates that as a specific region deforms and hardens, subsequent strain shifts to adjacent, unworked regions. This work-hardening mechanism distributes strain uniformly across the component, preventing premature localized necking during stretch-forming operations.
Plastic Strain Ratio ($r$-value or Lankford Parameter)
The $r$-value quantifies the material’s resistance to thinning through its thickness relative to its width under uniaxial tension:
$$r = \frac{\epsilon_w}{\epsilon_t}$$
Where $\epsilon_w$ is the true width strain and $\epsilon_t$ is the true thickness strain. An $r$-value greater than 1.0 indicates that the sheet resists thinning in the thickness direction, drawing material from the width plane instead.
Because cold rolling and subsequent annealing impart crystallographic texture—aligning preferred atomic planes along specific orientations—$r$-values vary depending on the testing direction relative to the original rolling direction. To characterize this directional variation, normal anisotropy ($\bar{r}$) and planar anisotropy ($\Delta r$) are calculated:
$$\bar{r} = \frac{r_0 + 2r_{45} + r_{90}}{4}$$
$$\Delta r = \frac{r_0 – 2r_{45} + r_{90}}{2}$$
- Normal Anisotropy ($\bar{r}$): Measures the average resistance to thinning. Higher $\bar{r}$ values (e.g., $1.8$ to $2.2$ for interstitial-free deep-drawing steels) correlate directly with higher Limiting Draw Ratios (LDR), allowing deeper cups to be drawn without tearing.
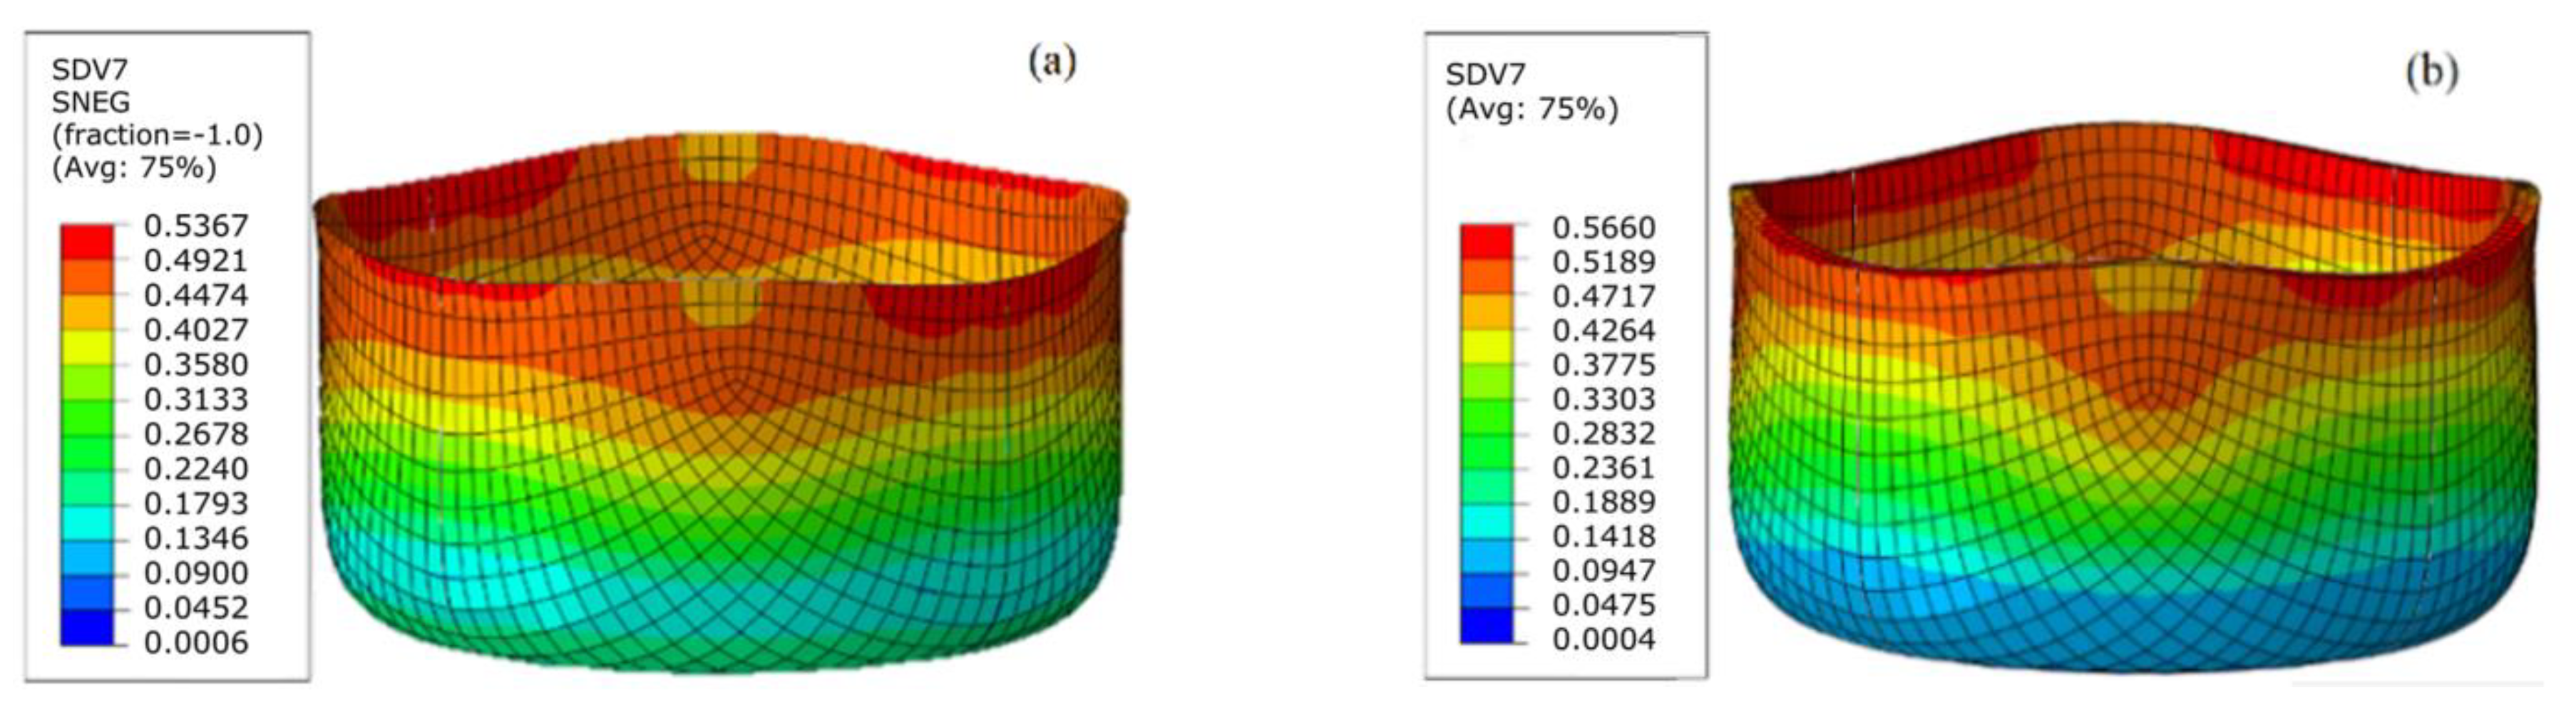
- Planar Anisotropy ($\Delta r$): Measures variation across the sheet plane. A non-zero $\Delta r$ causes “earing”—the formation of non-uniform, wavy height variations along the top edge of a drawn cup at 0°, 45°, or 90° relative to the rolling direction. Earing requires post-stamping trimming, increasing material scrap rates.
- Earing Pattern caused by Delta-r
- /\ /\ /\ /\
- / \ / \ / \ / \
- / \____/ \____/ \____/ \
- [ Drawn Cylindrical Shell Top Margin ]
Forming Limit Diagrams (FLD) and Strain Path Analysis
To evaluate formability and avoid failure during die design, press engineers utilize the Forming Limit Diagram (FLD). The FLD provides a graphical mapping of critical strain combinations, plotting Major Strain ($\epsilon_1$, the maximum principal strain) against Minor Strain ($\epsilon_2$, the orthogonal surface strain) measured from a grid of laser-etched or electro-chemically printed circles on the blank surface prior to stamping.
- Forming Limit Diagram (FLD) Curve
- Major Strain (e1) ^
- | FAIL ZONE
- | (Local Thinning / Necking)
- |
- | ================================= <– FLC Curve
- |
- | SAFE ZONE
- | (Stable Deformation)
- |
- +————————————-> Minor Strain (e2)
- -e2 (Draw) 0 +e2 (Biaxial)
The boundary line on this diagram is the Forming Limit Curve (FLC). Strain combinations plotting above the FLC result in localized necking and material splitting, whereas strain points below the curve represent safe, stable plastic deformation. The lowest point on the FLC curve ($FLC_0$) corresponds to plane-strain tension ($\epsilon_2 = 0$), which represents the most severe strain condition for sheet metals.
By adjusting blankholder pressure, modifying draw bead geometries, optimizing lubricant distribution, or tuning alloy crystallographic texture, tooling engineers shift strain paths away from plane-strain tension toward equal-biaxial stretching or pure draw strains. This optimization keeps processing strains safely below the material’s forming limit threshold.
Aluminium Sheets Kigali Rwanda
